


What is the VOLO™ Biomarker Reference Guide?
Most lab reports tell you whether a result is “normal” or not — a binary pass/fail based on population averages. The VOLO Biomarker Reference Guide (BRG) does something different. It tells you what your biomarker levels are statistically associated with over the next 15 years across major health domains. Associations are based on data from hundreds of thousands of actual individual health outcomes in the UK Biobank and validated with data from millions of individuals across US longitudinal clinical datasets.
The BRG is not a diagnostic tool. It is a proactive reference — designed to help you and your physician see patterns that single-variable clinical ranges were never built to reveal.
Six health domains, one integrated view
Rather than evaluating each biomarker in isolation, the BRG shows how it relates to long-term disease incidence across six domains simultaneously:

Each domain is anchored to a specific, measurable endpoint — not a vague concept of “health.” For example, cardiovascular risk is modeled as Major Adverse Cardiac Events (MACE), which include heart attacks, strokes, and cardiovascular mortality. Longevity is modeled as 15-year non-accidental all-cause mortality to age 85.
Two concepts that power the BRG
Risk Multiplier (RM) | VOLO™ Modeled Range (VMR) |
|---|---|
A number showing how much higher the observed disease incidence is in a given biomarker range compared with the lowest-risk group, which is always set to 1.0. A risk multiplier of 2.4 means that group had 2.4 times the observed incidence — not twice the certainty of disease, but twice the statistical frequency in the research population. | The range of values statistically associated with the lowest 15-year disease incidence across all modeled domains at once. The VMR is not a textbook “normal” range — it is VOLO Health’s data-derived target zone. Often it is meaningfully different from standard clinical reference ranges, and in some cases more conservative. |
How to read a BRG chart: A worked example
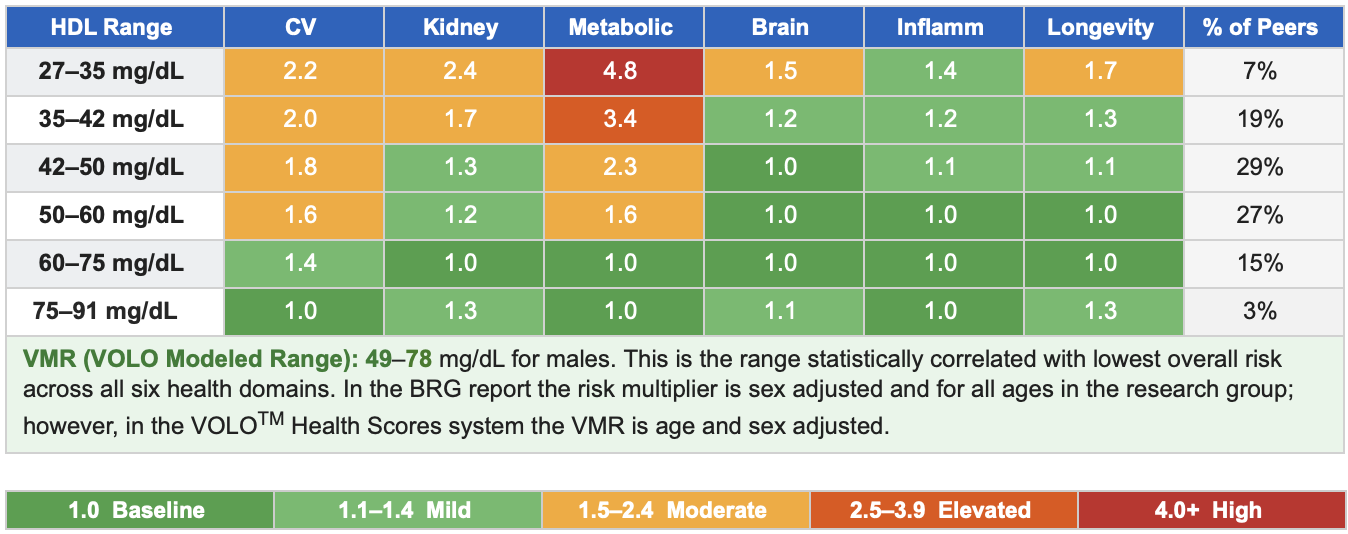
Every biomarker in the BRG is presented in a table like the one below. This example uses HDL cholesterol for males. Each row provides a range of HDL values. Each colored column shows the risk multiplier for that domain. The “% of Peers” column shows what proportion of the research population falls in that range — giving you context for how common or rare your level is among the research group.
Reading the example above:
A male with HDL of 27–35 mg/dL carries a metabolic risk multiplier of 4.8 — nearly five times the incidence of the lowest-risk group, while the CV multiplier is 2.2. Only 7% of peers in the research group fall in this range.
Moving up to 42–50 mg/dL, metabolic risk drops to 2.3 and kidney risk to 1.3 — meaningful improvement, though still elevated. Nearly 29% of males fall here, making it the most common range and closely followed by the distribution in the 50-60 mg/dl range at 27%.
At 60–75 mg/dL, risk reaches 1.0 (baseline) across metabolic, brain, and inflammatory domains — this is where observed risk levels are lowest for all categories.
The VMR (49-78 mg/dL) is the VOLO Modeled Range — the data-derived target zone for males, which spans across a couple of rows in the chart.
Colors move from green (lowest risk) through yellow and orange to red (highest risk). The grey “% of Peers” column shows population distribution, not risk level.
All tables are presented separately for males and females, as risk profiles and VMRs differ meaningfully by sex.
What’s inside the BRG?
The BRG covers over 70 biomarkers including some non-blood metrics across nine categories, each with sex-stratified risk multiplier tables, VMR values, and plain-language definitions:
Physical / Vitals | BMI, blood pressure, resting heart rate, waist circumference, grip strength, smoking history, body fat % |
Lipids | LDL, HDL, triglycerides, ApoB, Lp(a), LDL-ApoB ratio |
Metabolic Panel | Blood glucose, HbA1c, creatinine, uric acid, liver enzymes (ALT, AST, ALP, GGT) |
Advanced Biomarkers | CRP, cystatin C, IGF-1, SHBG, testosterone, vitamin D |
Complete Blood Count | RBC, WBC, hemoglobin, hematocrit, MCV, RDW, lymphocytes, neutrophils |
Lifestyle Choices | Dietary habits (beef, cheese, alcohol types, salt, water), self-reported |
Metabolites (NMR) | Omega-3/6 fatty acids, branched-chain amino acids, glycine, glutamine |
Proteins (Olink) | GDF15, NEFL, GFAP, and 10+ additional circulating proteins |
Nutraceuticals | Includes vitamins, minerals, and bioactive compounds |
A few findings worth knowing
Cystatin C shows the strongest correlations in the dataset This kidney protein — rarely ordered in routine labs — emerged as a top correlation across many health domains, including cardiovascular and brain health. It outperforms creatinine for estimating kidney function and is not affected by muscle mass, ethnicity, or dietbased on our research. | Common markers are not always the most highly correlated LDL cholesterol — one of the most routinely monitored markers — did not emerge as a top cardiovascular correlations in the VOLO Health model. This does not make it unimportant, but it highlights that clinical attention is not always aligned with predictive signal. |
Quitting smoking produces measurable modeled improvement Individuals who reported quitting showed 23–51% improvement in cardiovascular risk multipliers within 2 years. At 20 years post-quit, improvements reached up to 83%. Earlier quitting and lighter smoking histories showed the most rapid early gains. | Lp(a) does not show high correlation in this model — but still matters Lipoprotein(a) did not emerge as a top correlation for the specific endpoints modeled. This is a model-specific finding and should not suggest Lp(a) is clinically unimportant. The AHA has identified it as a genetically determined, causal risk factor for cardiovascular disease. |
The bottom line
The BRG is not a replacement for your doctor or standard lab ranges. It is a complementary lens — one that asks a different question. Instead of “is this value normal?” It asks “what does this value tell us about 15-year risk across multiple dimensions of health?” Used alongside standard clinical care, it supports a more proactive, integrated, and personalized approach to long-term wellness.
The VOLO™ Health Biomarker Reference Guide is provided solely for informational and educational purposes. It is not intended to diagnose, cure, mitigate, treat, or prevent any disease or medical condition and does not provide medical advice or individualized risk predictions. Statistical associations described herein are not evidence of causation. Individuals should consult a qualified healthcare professional for questions regarding diagnosis, treatment, or prevention.

