


Start here
Every number in the VOLO™ Health Report (VHR) comes from one value: the 15-year Risk Ratio, which shows how the patient’s biomarkers compare to age- and sex-matched peers. The VOLO™ Score, VOLO™ Age, and the Impact figures are all that same value shown in three different ways. Read them as a long-term outlook relative to peers, not as a statement about disease today.
Long-term outlook, not diagnosis: a 15-year outlook.
Average isn’t the ceiling: a VOLO Score of 200 is average; above 200 is healthier.
Part 1: What the numbers mean
The four metrics (what each metric tells you and how to read it)
Metric | What it means | How to read it |
|---|---|---|
Risk Ratio | 15-year domain risk vs. the average peer | The base metric. Everything else is derived from it. Higher = more risk. |
VOLO Score | The Risk Ratio on a 200-centered index | Your tracking number. Higher is better; 200 = average peer risk. Read the category (color band) together with the trend over time. |
VOLO Age | Domain risk expressed as a functional age | Read the delta vs. chronological age: more negative is better, indicating years below actual age. Useful for patient motivation. |
Score Impact | One biomarker’s effect on the domain score | Positive = favorable, lowers domain risk. Negative = unfavorable, raises domain risk. The biomarkers with the largest impact values (either direction) are driving the domain score. |
Interpreting the VOLO Score
POOR | MARGINAL | AVERAGE | GOOD | EXCELLENT |
|---|---|---|---|---|
<180 | 180-194 | 195-205 | 206-220 | >220 |
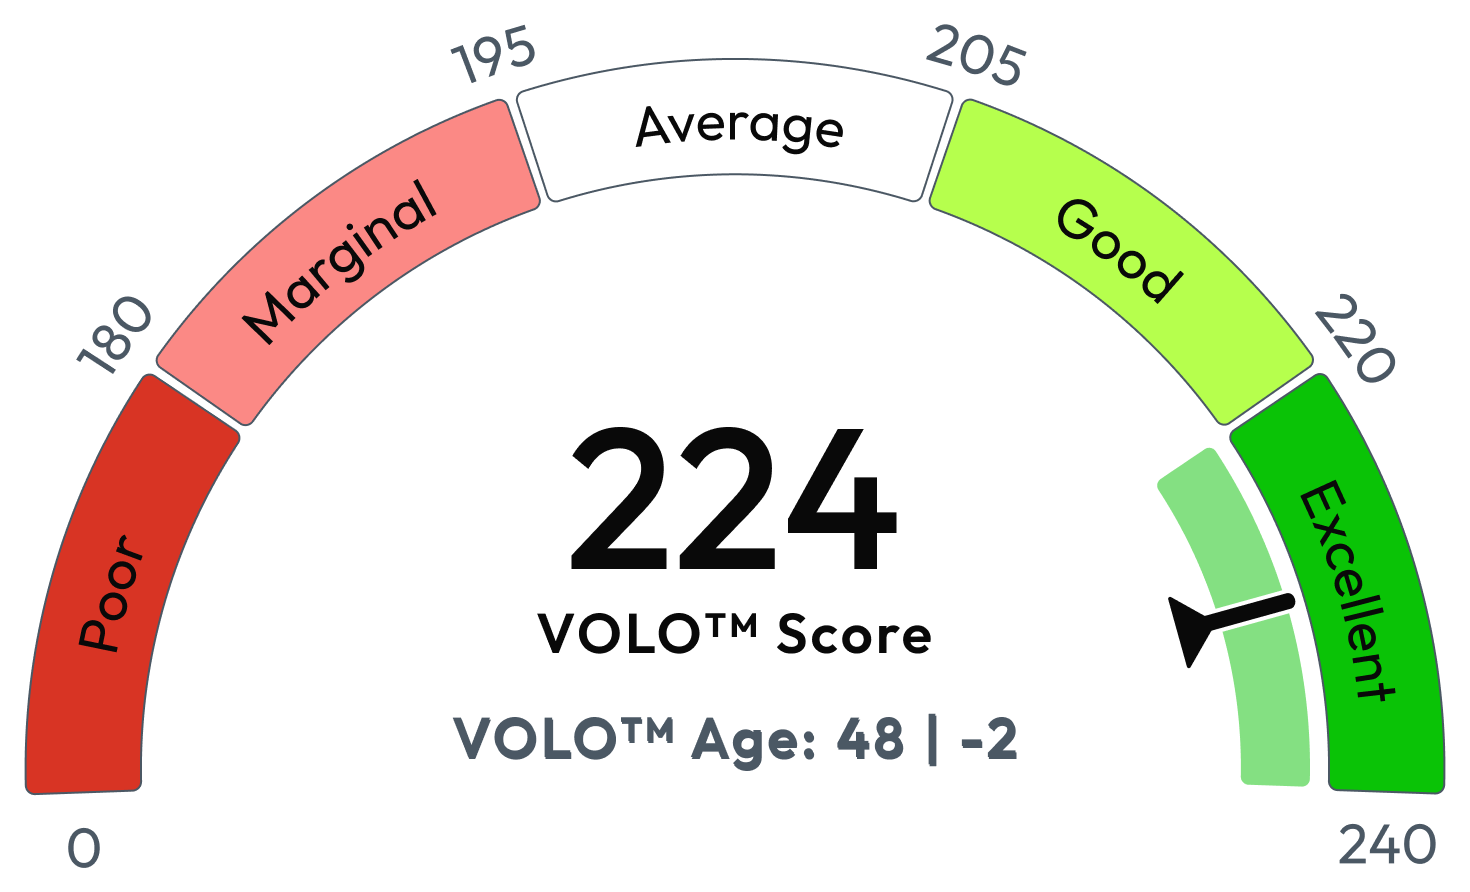
The 20-point rule: Every 20-pt move ≈ halving or doubling of relative domain risk. Up is better (200→220 halves); down is worse (200→180 doubles). Also read the score against its domain maximum, which varies by domain based on population risk variation: 212 of 225 leaves little headroom (maintain), 212 of 275 signals room to improve.
VMR vs. traditional lab reference range
The VOLO Modeled Range (VMR) is the biomarker range tied to the lowest 15-year composite risk across all domains for that patient’s age and sex, derived from population outcomes rather than lab convention. A biomarker can be “normal” by the lab yet still fall outside the VMR, the optimal target. When the two disagree, follow the VMR for long-term health. Established treatment targets (e.g., LDL in known CVD) still take precedence. A biomarker outside its VMR can still add points in a domain. The VMR balances all six domains at once, while Score Impact is per domain.

A value inside the lab band but not within the VMR is a good patient teaching case.
Two reference points (where “zero” sits, per metric)
Average peer (VOLO Score and Risk Ratio) | 200 = Risk Ratio 1.0 = expected for the average peer of that age and sex (excludes smokers, major cardiac/cancer history). Average, not optimal. |
VOLO Age delta | 0 (zero) = functional age matches actual age. Negative is better (functionally younger); positive is worse. |
Risk multiplier (biomarker reference, not in the VHR)
What it is: How a biomarker range’s 15-year disease incidence compares to the lowest-risk range, by age, sex, and domain. 1.0 = healthiest range (unlike Risk Ratio’s 1.0 = average peer); 1.5 = 50% higher incidence than that floor.
Example: Risk multipliers for hs-CRP: Males (VMR: 0.43 to 1.27 mg/L)
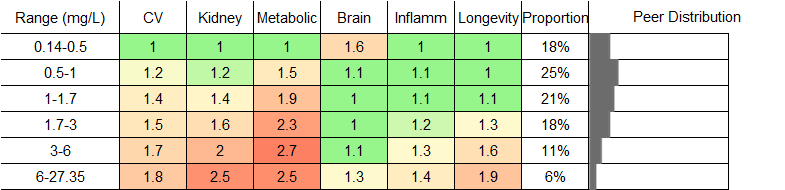
How it helps read the VHR: Score Impact and Strength show that a biomarker is helping or hurting, and how strongly. Use the Risk Multiplier to see how the patient’s range compares to the best-performing range, across all six domains.
When to use it: The online VOLO Health Biomarker Reference Guide shows risk variation across the biomarker’s full range, domain by domain, to help decide whether it’s worth addressing.
Six highlighted default domains (each a 15-year prevalence prediction)
Domain | What it predicts |
|---|---|
Cardiovascular | Heart attack, stroke & cardiovascular death |
Kidney | Acute kidney disease & renal failure |
Metabolic | Type 2 diabetes & metabolic syndrome |
Brain | All-cause dementia & cognitive decline |
Inflammation | Est. inflammatory risk via GDF-15 correlated markers |
Longevity | Survival trajectory to age 85 |
Six of the default domains are highlighted here; reports may include additional domains over time.
Review cadence: Full panel at least annually; targeted re-checks every 3-6 months for patients tracking a specific change.
Part 2: Reading the report (what you see in each section)
Section 1: Methodology (definitions)
Defines every metric, written for patients. Skim it to anticipate questions.
Section 2: Results overview (start here)
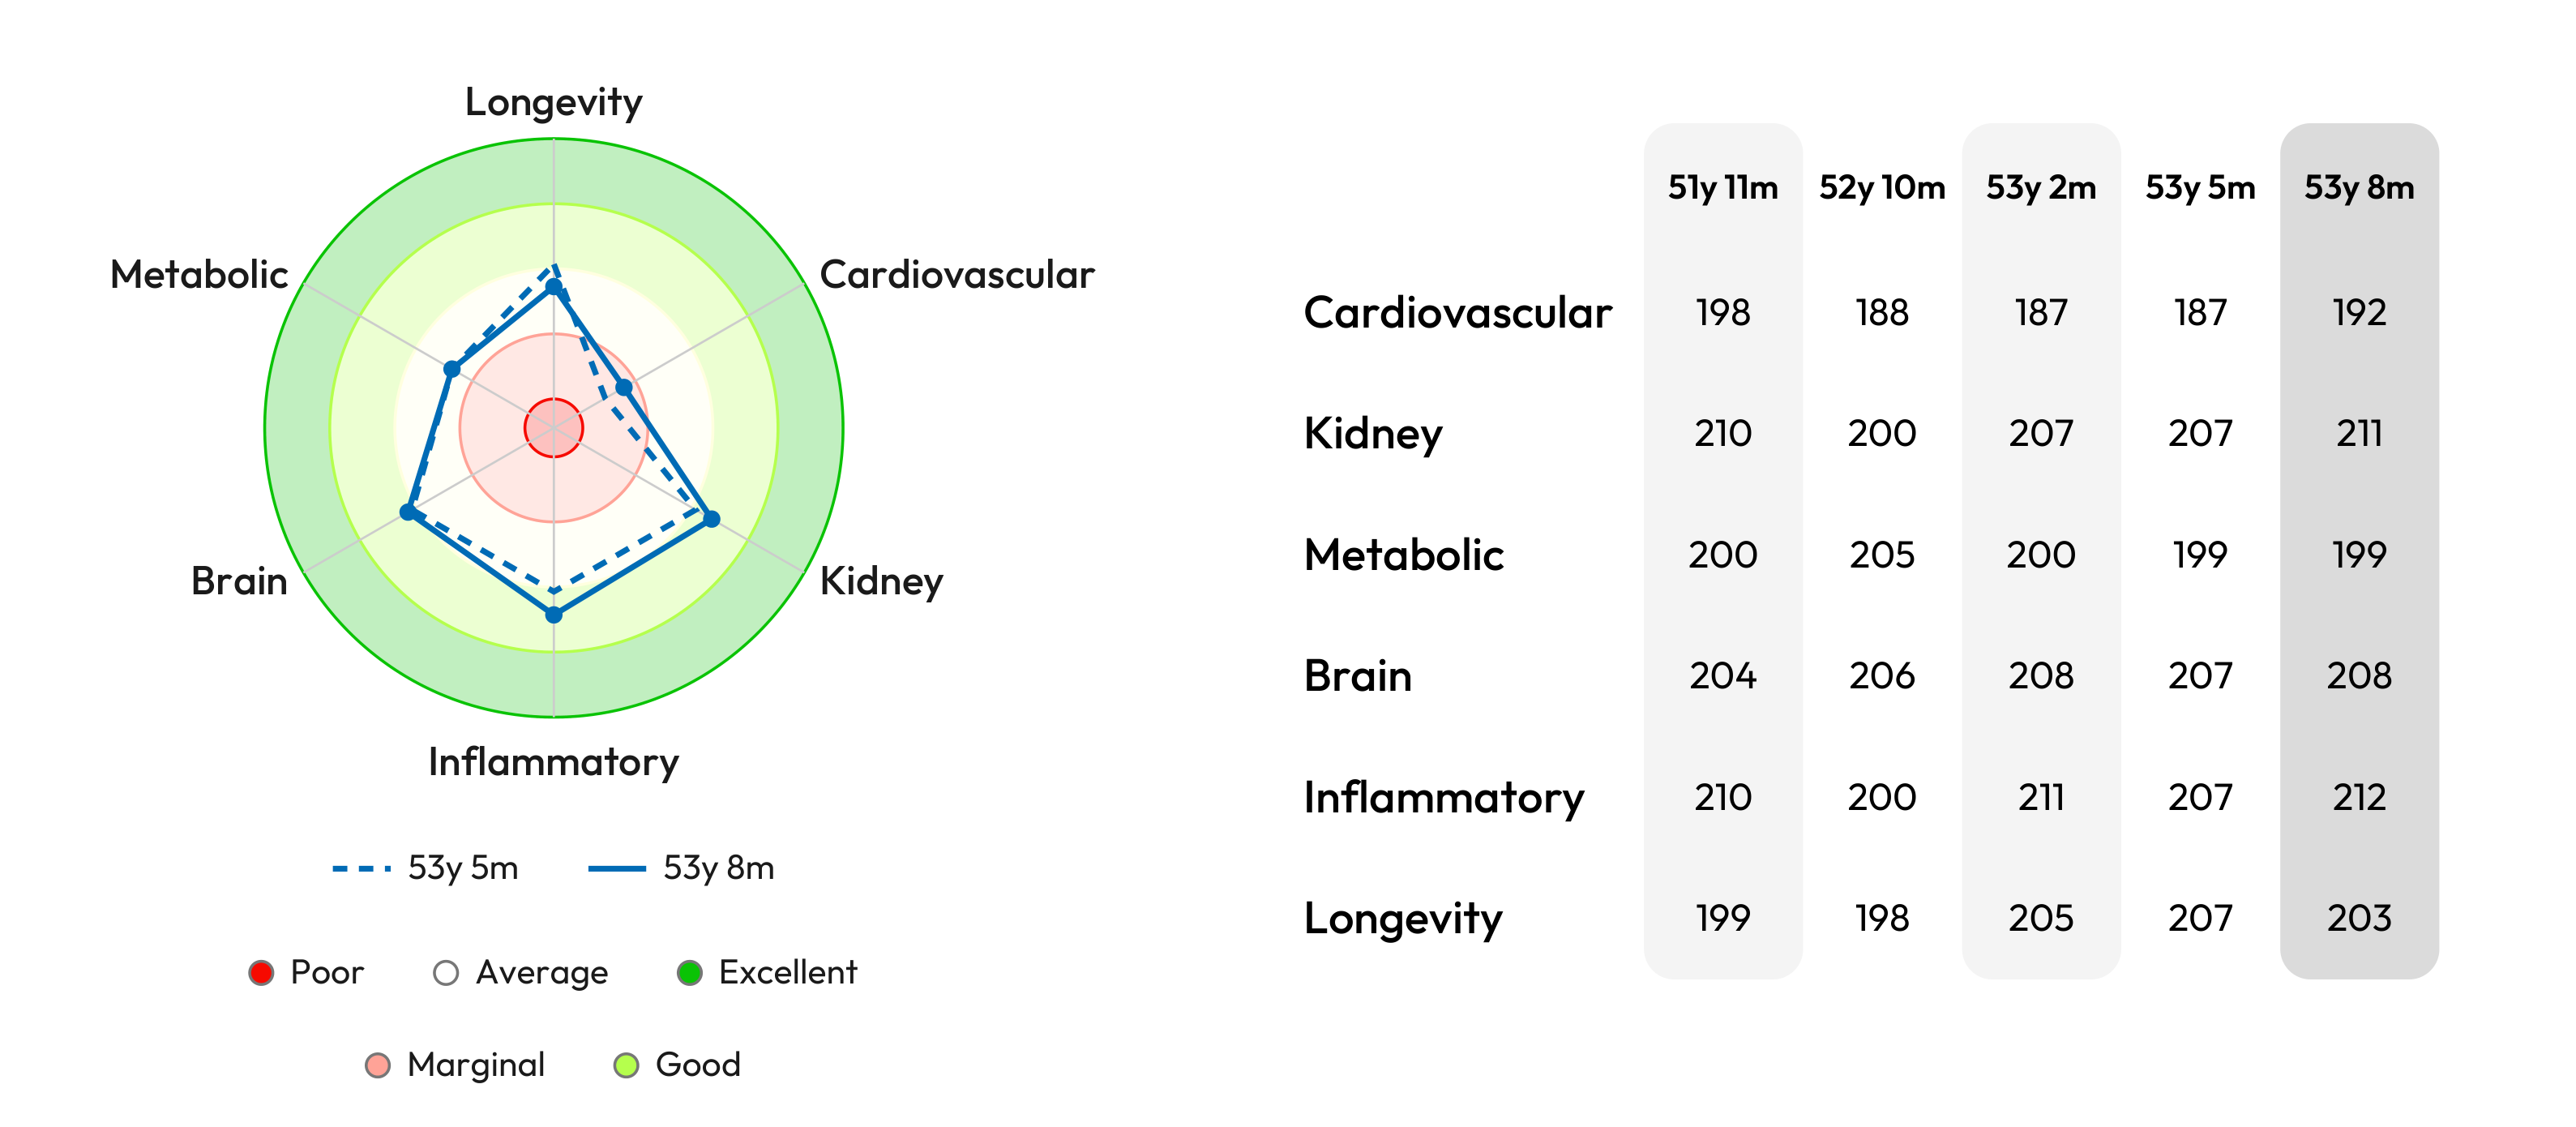
Radar: explains the overall domain pattern at a glance. Spokes = domains; dashed = prior, solid = current; outer ring = max possible score.
Score Grid: each domain’s score across up to five visits.
Top Individual Biomarkers: Opportunities for Improvement & Maintain

Your action list: Improve vs. Maintain. A value outside the blue VMR (even if inside the gray lab range) is where there’s room for improvement. For one domain in depth → Section 3.
Score Change Overview (shown when a VHR covers more than one set of measurements): when multiple measurement sets are available, this highlights the domain’s direction since the last visit and identifies the five biomarkers most responsible for the change.
Section 3: Scores by domain (core discussion)
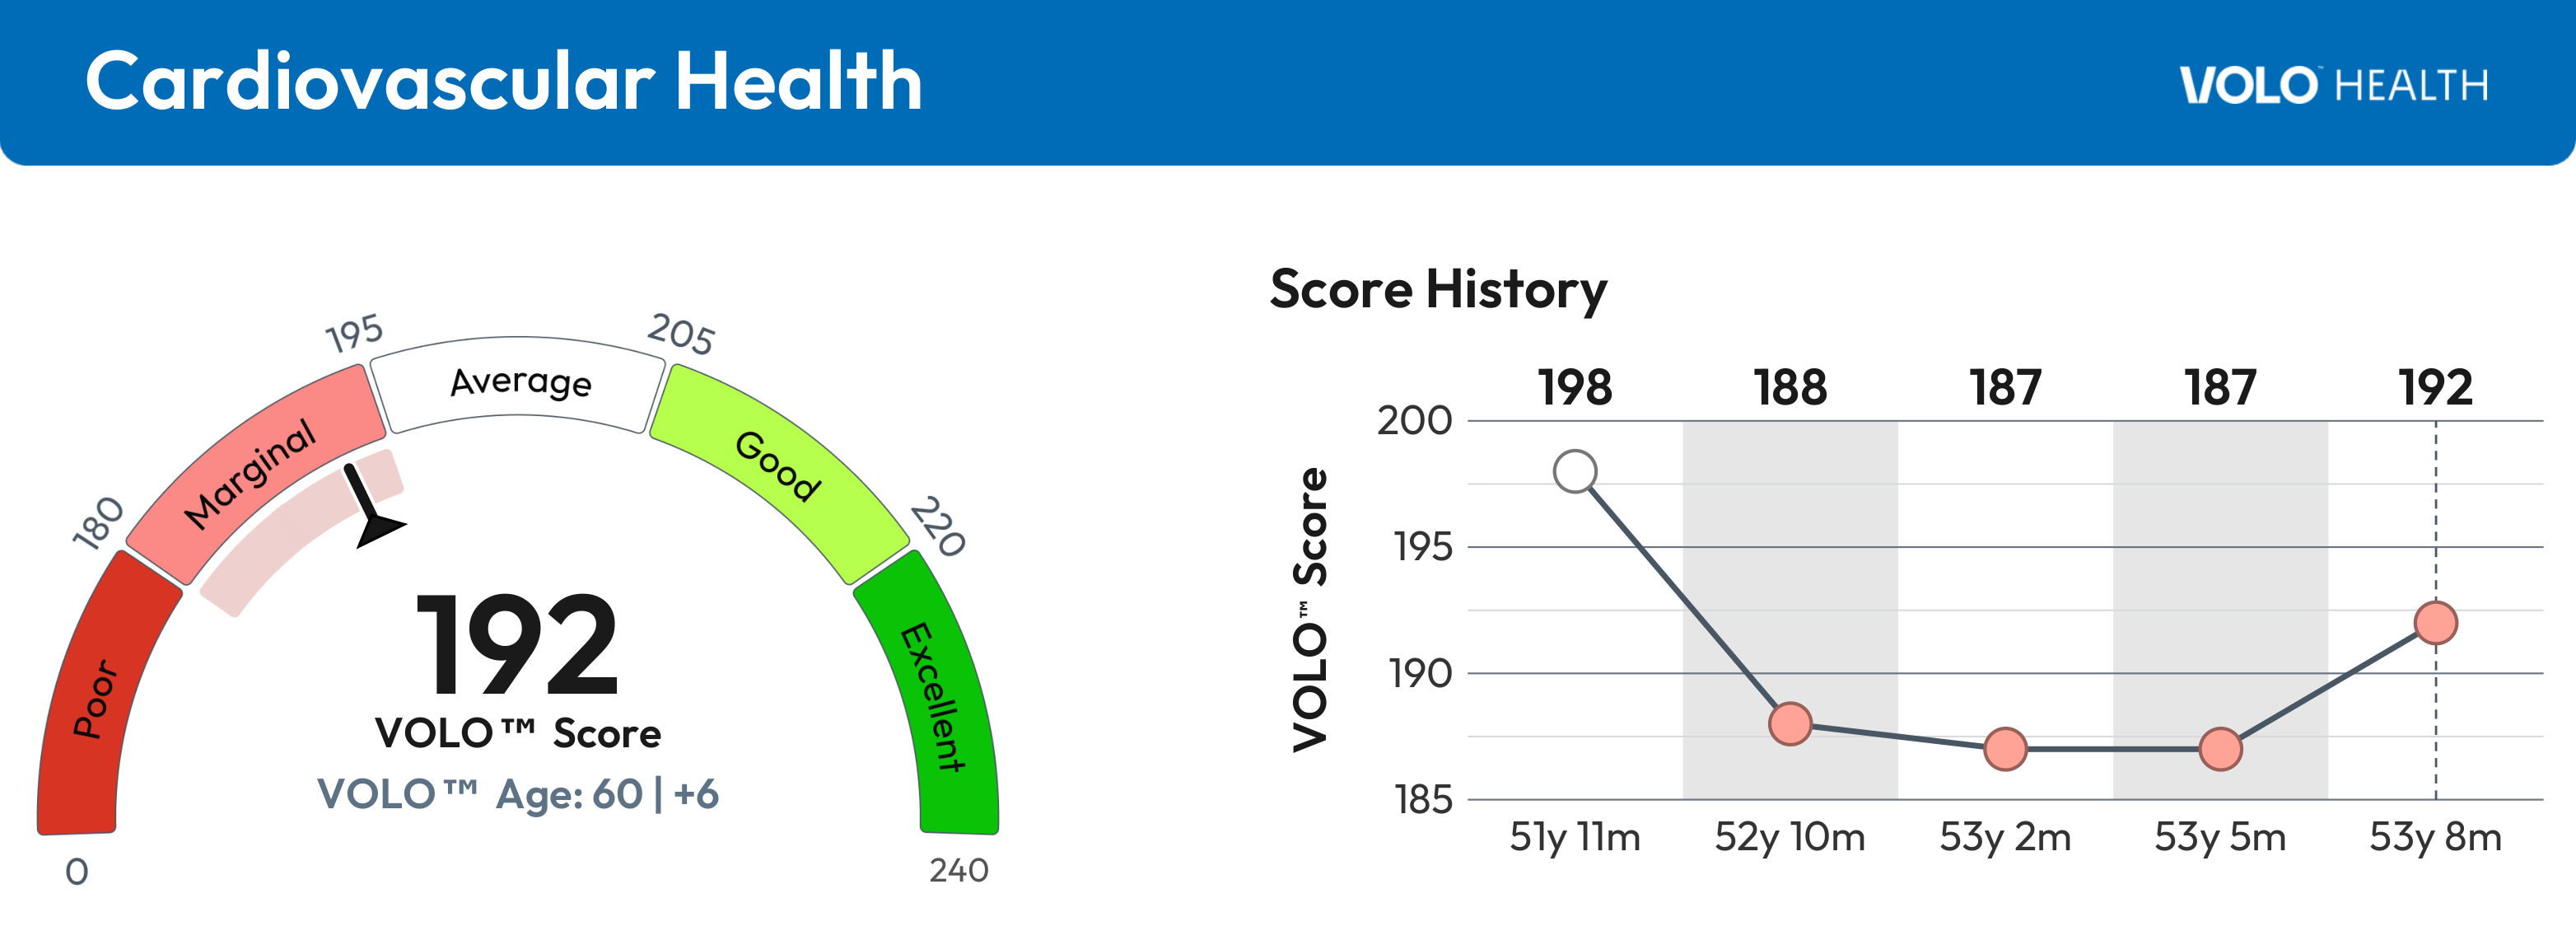
Lead with the gauge and the VOLO Age delta. The gauge shows current score, color band, and VOLO Age with its delta. A large negative delta is the good-news story. Read the score-history line for inflection points that point you to Section 4. Biomarkers below the gauge are ranked by Strength.
Section 4: Scores by biomarker (why it moved)
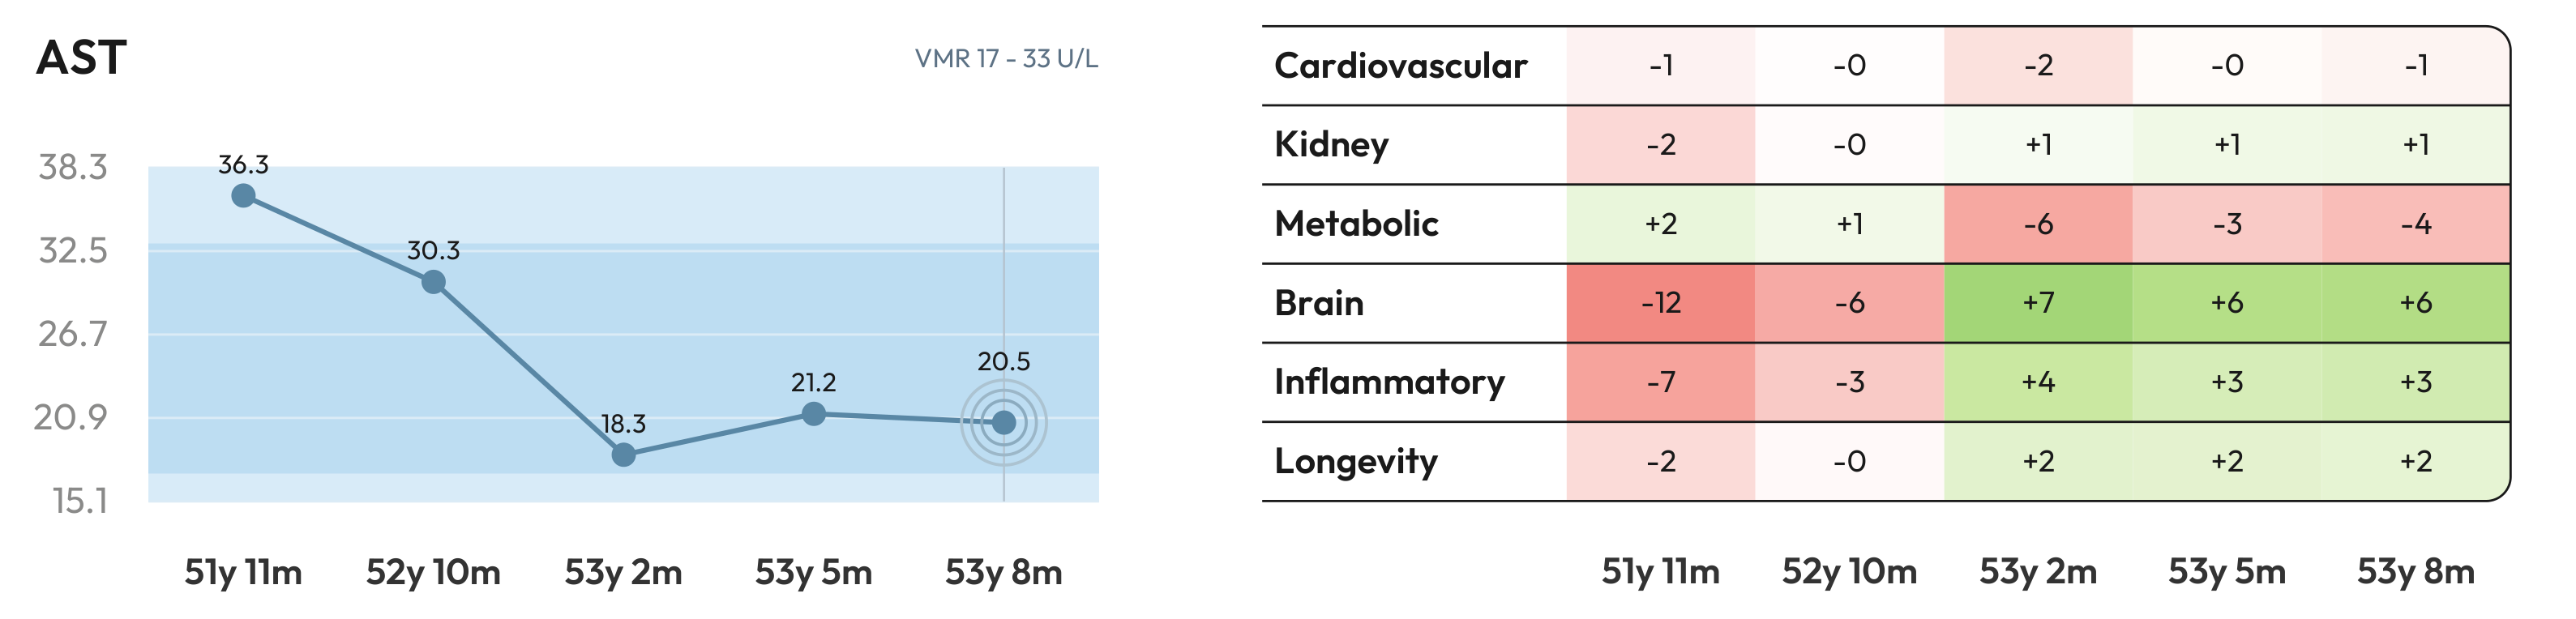
One biomarker, its impact across all six domains over time. Left graph = value vs. VMR; right table = Score Impact per domain (green = favorable, red = detrimental).
Find high-leverage biomarkers: those colored across many domains, sometimes in opposite directions. As AST falls into the VMR (image above), Brain improves (−12 to +7) while Metabolic worsens. Interpret impact together with Strength (a big impact on a high-Strength biomarker is a firm target), and check each domain’s trend separately.
Section 5: Appendix (deep reference)

Strength Table: How strongly each biomarker correlates with each domain (10 = strongest, 1 = weakest). Separates universally strong markers (Cystatin C, HbA1c) from domain-specific ones. This is a reference table and is the same for every patient. Check before acting on an impact.
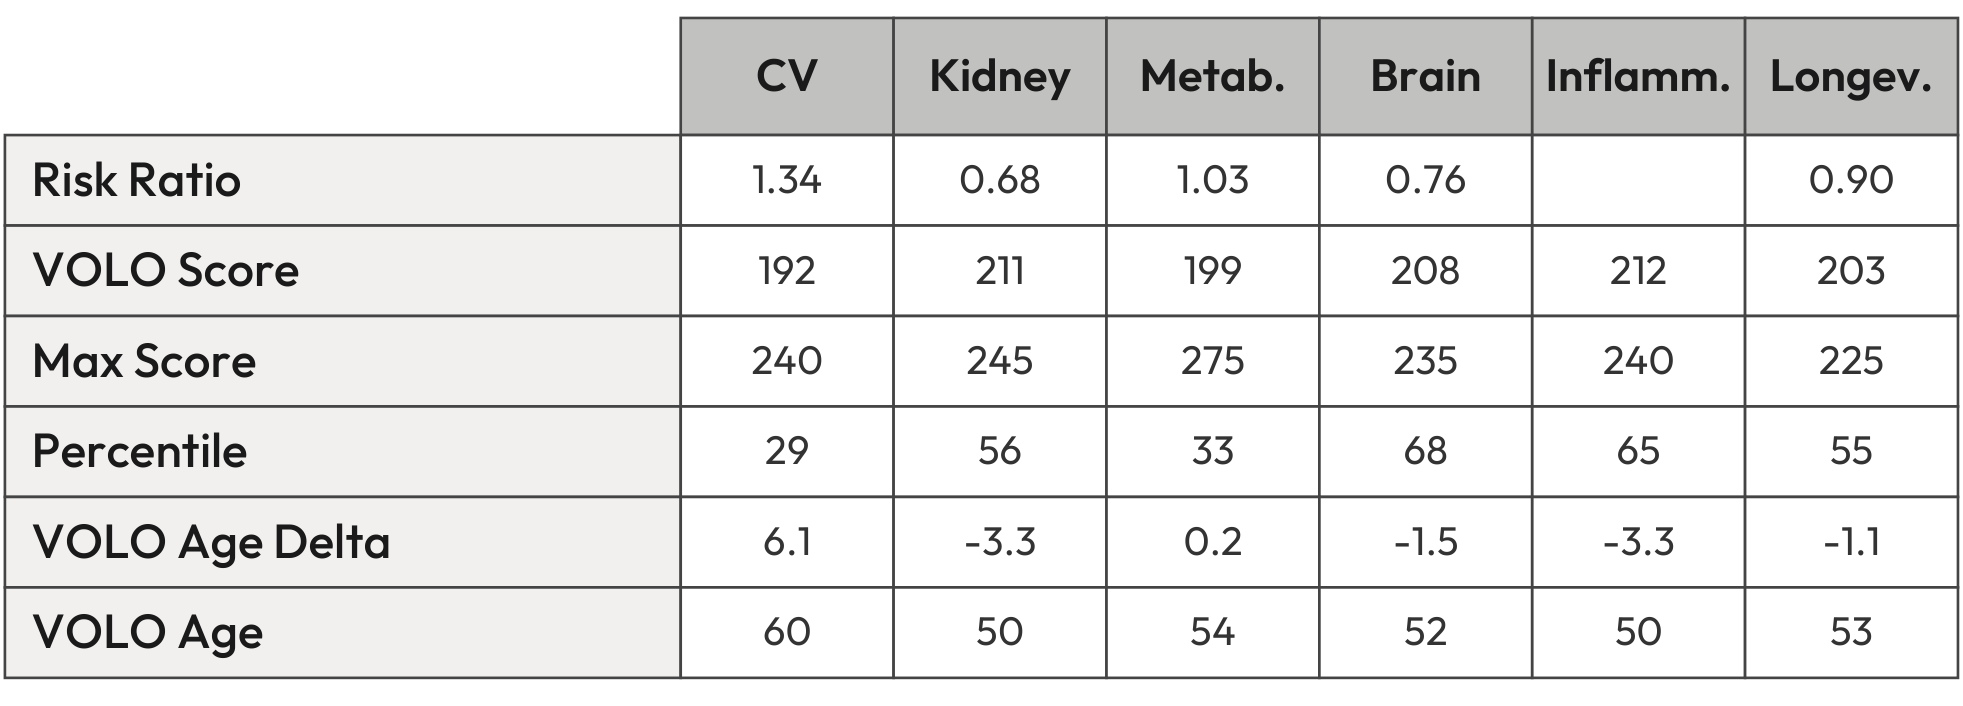
VOLO Score Summary Table: Opens with a domain summary: each domain’s Risk Ratio, VOLO Score, Max Score (headroom check), Percentile, and VOLO Age (with delta). It then lists every biomarker’s value and VOLO Score Impact across all domains.
Interpretation cautions (impact, imputed, carried values)
Impact ≠ value. Impact is multivariate: a biomarker can hold its value over time yet show a different impact as surrounding biomarkers change.
One poor domain? Domains are modeled independently. Open that domain in Section 3, or its column in the Section 5 summary, to find biomarkers lowering it.
Imputed (*): Estimated, not measured. If a high-Strength biomarker is starred, consider adding it to the next lab draw.
Carried-forward value (f): A real value applied to a later timepoint within the 2-year window.
Carried-backward value (b): A newly measured value replaces earlier imputed points within the 2-year window.
Reading one domain end to end (illustrative only, not clinical guidance)
Workflow: Start with what changed (Section 2), go deeper by domain (Section 3) or biomarker (Section 4), and confirm in the appendix (Section 5).
Example: Metabolic
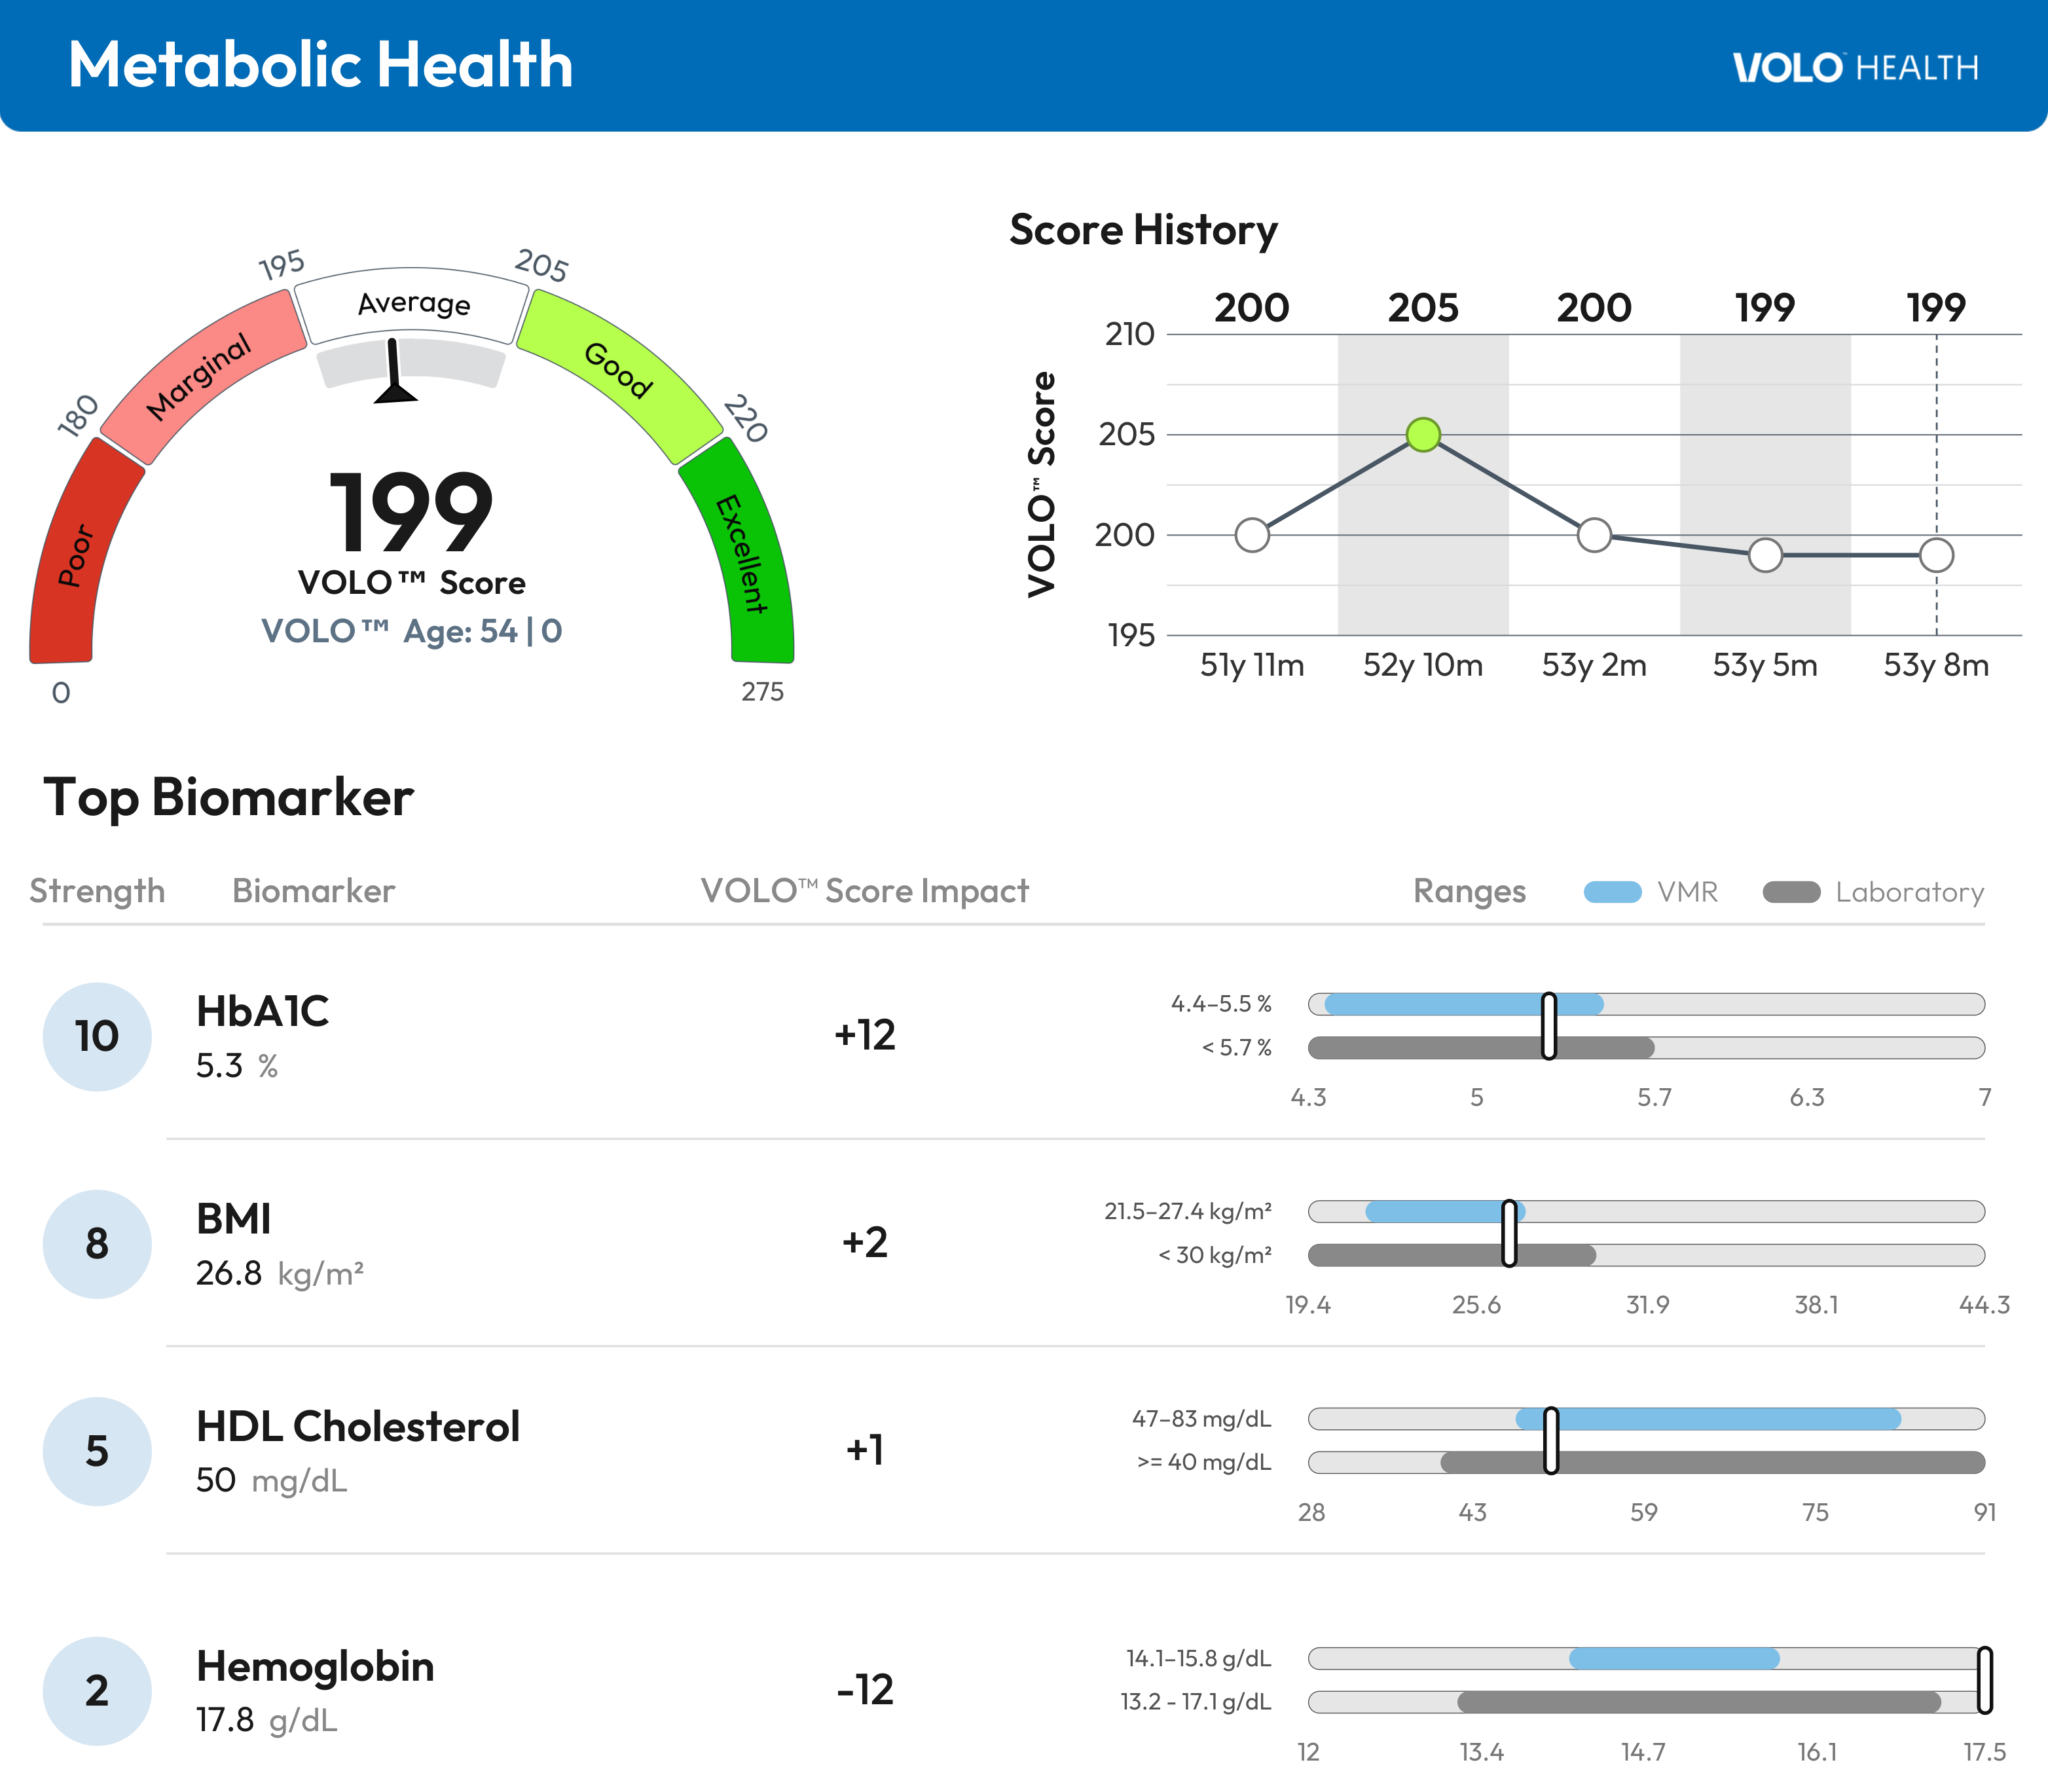
Start at the gauge. 199 (Average), VOLO Age 54 (0 age change, as expected). VOLO Score is 199 of 275: significant room to improve.
Find the biomarkers driving score impact. Holding it up: HbA1c 5.3%, in VMR, +12, Strength 10: the biggest driver, so maintain or improve. Lowering it: Hemoglobin −12, but Strength 2, so weigh lightly before acting.
Check the trends, then set goals. 200→205→200→199→199, slight drifting. Maintain/improve HbA1c, improve BMI. Before targeting Hemoglobin, you can also confirm it in the Section 2 Opportunities for Improvement list and refer to Section 4 to view the individual Hemoglobin value trend and the corresponding VOLO Score impact table.
The VHR is a general health & wellness education tool — not a diagnostic instrument or FDA-reviewed medical device. Interpret in the context of the full clinical picture. VOLO Health © 2026

